


SOH in battery – definition and measurement methods


Necessity of detecting soh in battery
With the rapid growth of the number of electric vehicles, power batteries as the key core components of electric vehicles, the performance testing and evaluation is an important part to ensure the power and safety performance of electric vehicles. According to statistics, in 2022, China’s power battery installed capacity was 261GWh, a year-on-year increase of 86%.

With the popularization of electric vehicles, the safety issues of lithium-ion power batteries have become increasingly prominent. The SOH in battery is a reflection of the battery’s health and life, and the battery’s power, charge and discharge rate, and other data. Accurate evaluation of the SOH in battery can help users understand the current state of the battery.
Make a maintenance plan according to the underlying premise, and correct the performance indicators of various parameters, to reduce or avoid the risk factor, so as to decide whether maintain or replace the single battery whose performance cannot meet the requirements of use, which is a great save of the cost of use. Modeling and analyzing SOH in battery to achieve accurate prediction and evaluation is the difficulty and focus of battery application research and reliability research.
Reasons for detecting soh in battery
- When the internal resistance increases after the battery ages, there will generate more heat and cause thermal runaway or battery failure more easily.
- Health status indicates the current health level of the battery.
- Decline laws of different battery are inconsistent.
- The SOH in battery the basis for estimating the mileage of electric vehicles, also an important parameter to assist in correcting and improving the accuracy of SOC estimation, and the basis for predictive maintenance.

Definition of SOH in battery
Battery aging is a gradual and complex process. Nevertheless, researchers still hope to find some quantifiable indicators to describe the degree of battery degradation. There are two principles for choosing such indicators:
- The indicators are typical and can reflect the degree of battery aging.
- It is operable, and it is not operable to define the degree of aging by using the remaining cycle times of the battery.
In the actual detecting process, SOH in battery can be defined according to different application scenarios.
Define SOH from the perspective of HEV:
SOH in battery is an indication of battery internal resistance increase or power attenuation. If the lithium ion battery internal resistance increases to the limit of power usage, it means that the battery has reached the EOL (End Of Life) condition. Therefore, SOH can be defined according to the following expression:

Here, REOL refers to the internal resistance of the battery at the end of the battery life, RBOL refers to the internal resistance of the battery when it leaves the factory, and R is the internal resistance of the battery in its current state.
Define SOH from the perspective of battery capacity:

Here, CEoL means the capacity value at the end of battery life, CBoL is the capacity value of the brand new battery, and C is the actual battery capacity value at the current status.
In addition to the above two SOH definition methods, in the actual battery group application process, we can also define SOH in battery from indicators such as battery aging inconsistency and battery self-discharge rate.
Most manufacturers in China define SOH based on the number of remaining cycles or cumulative ampere-hours or watt-hours of energy of the battery, but there are too many uncertain factors in the actual use process, and it is impossible to predict the use environment of the battery in the future use scenarios, and it is also impossible to accurately predict the number of remaining cycles, so these definitions are not very operable.

SOH measurement method
Generally speaking, the SOH of a new power battery is set to 100%. With the use of the battery, the battery continues to age, and the SOH in battery gradually decreases. It is clearly stipulated in the IEEE standard 1188-1996 that when the capacity of the power battery decreases to 80%, that is, when the SOH in battery is less than 80%, the battery should be replaced.
The SOH measurement method refers to directly obtaining some characteristic parameters that can reflect the decline of the power battery by analyzing the collected experimental data such as power battery current, voltage, temperature, etc., so as to realize the calibration of the SOH in battery. According to different parameters, it can be divided into direct measurement method and indirect analysis method.
Direct measurement method
The direct measurement method uses the measured data or simple processing to directly calculate SOH in battery.
Measurement of internal resistance by electrochemical impedance spectroscopy
Electrochemical impedance spectroscopy (EIS) is a non-destructive parameter determination and an effective method for the determination of battery kinetic behavior. Applying a sine wave voltage signal with frequency w1 and small amplitude to the battery system, the system generates a sine wave current response with frequency w2, and the change in the ratio of the excitation voltage to the response current is the impedance spectrum of the electrochemical energy storage system.
EIS has high practicability. This test method can scan from very low frequency (several μHz) to very high frequency (several MHz) to realize electrochemical interface reaction research in a wide frequency range. At present, most of the research in China is still in the initial stage of exploration, and most of them focus on EIS curve analysis and related electrochemical interpretation.
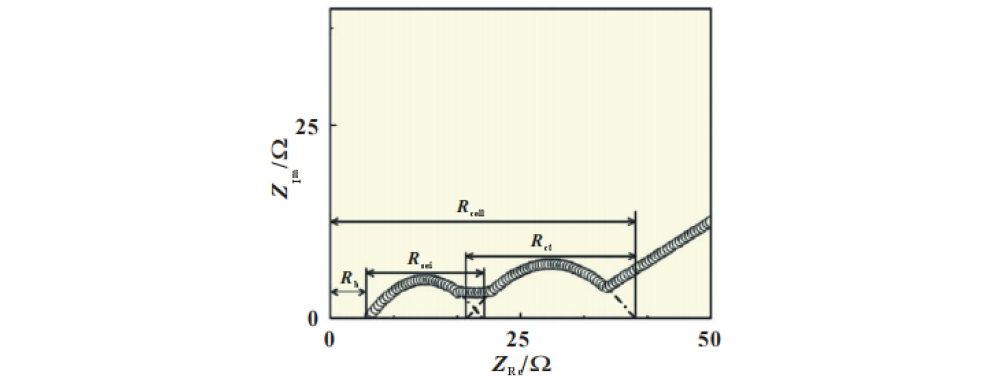
In the figure above, the abscissa ZRe is the real part of the impedance, and the ordinate ZIm is the imaginary part of the impedance. The meanings of other parts are as follows: the first part is the ultra-high frequency part, and the part where the impedance curve intersects with the horizontal axis is the ohmic impedance Rb.
The second part is the high frequency part, and the semicircle refers to the impedance Rsei of lithium ions passing through the solid state battery electrolyte. The third part is the intermediate frequency part, the semicircle refers to the charge transfer impedance, also known as the electrode polarization impedance Rct. The fourth part is the low frequency part, and the 45° straight line is the lithium ion diffusion impedance, also known as the concentration polarization impedance W.
Battery stack stress
The battery gradually increases with the stress between the cells used, because the battery will expand during use, and some gas will be generated inside. The stress between the cells can be used to estimate the SOH in battery, as shown in the figure below.

Filtering algorithm
Based on the equivalent circuit model method, the curve formed by the open circuit voltage and the state of charge, the filter method is used to dynamically calculate the OM internal resistance of the battery, and the influence of temperature on the SOH-OCV-SOC surface needs to be considered.
Voltage curve reconstruction
The model-based power battery state estimation algorithm usually uses the functional relationship between the open circuit voltage (OCV) and the state of charge (SOC) to correct the SOC estimated value obtained by the ampere-hour integration method, so the SOC estimation accuracy is very dependent on the OCV-SOC curve precision.
Indirect analysis method
Sample entropy of discharge voltage
Extract the sample entropy of the discharge curve and bring it into RVM to estimate the health status. The sample entropy can provide a calculation method to evaluate the predictability of the time series and quantify the regularity of the data series. Therefore, when it is applied to the discharge temperature data, it can be used as an indicator of the SOH in battery, and it has a good effect on capturing the degradation process and local changes of the battery.
DTV, DVA, and ICA curves

Fit the smooth capacity increment curve, extract the peak value and position, establish the relationship function between the health status and the peak position, and estimate the SOH in battery. The smoothing of DTV, DVA, and ICA curves has always been a difficult problem.
The same variable extracted by different smoothing techniques may not be equal, and the curves of different sampling frequencies are also different. Temperature and charge-discharge rate also affect the model parameters. Therefore, the performance of the three methods is not stable.
Hybrid pulse power characterization test
The hybrid pulse power characterization test comes from the US FreedomCAR hybrid vehicle inspection manual. Its basic test idea is to conduct pulse charge and discharge tests on the power battery under different SOCs. Through calculation, the power performance of the power battery in the entire range of use can be obtained.
Firstly, the DC internal resistance of the battery needs to be calculated, which is actually the ratio of the voltage drop before and after the pulse to the current:


If the temperature is different, the DC internal resistance of the battery at different temperatures can be calculated, which is very meaningful data for the thermal simulation of the whole vehicle.
Conclusion
When the actual power battery is in use, its working condition process is very complicated, so each test has limitations, so in practice, it is necessary to combine methods and learn from each other. After obtaining the calculated value, use the obtained power value to perform constant power charging and discharging on the battery for verification, so that more accurate results can be obtained.
The estimation of SOH in battery is of great significance to the safe operation of electric vehicles, and the development of big data technology provides a powerful tool for SOH estimation. Although a lot of theoretical and experimental results have been obtained, the application of power battery SOH estimation methods in real EV battery cell still faces many challenges.


Leave a comment